XC Skies and its
usefulness in forecasting Marshall/Crestline
by David Webb, 2024/3/29-a
XC Skies is a graphical forecasting tool that
presents data from multiple weather models. It’s very
handy for looking at multiple models at once to get comparisons of the day and
when there is agreement among the models, one can be fairly sure of an accurate
forecast. This requires a paid subscription to use ($40 for a year), but one
can sign up for a 30 day free trial if unsure about
using it long-term. I find the inexpensive subscription to be worth it. It is
usable on your phone, but not awesome: It’s a much better tool to use on a
larger screen (tablet or computer) due to all of the menus and indicators.
Here
is a link to their documentation to get
into details about signing up and navigating around the tool (I will point out
a few simple things I look at below, but the documentation will describe every
detail).
I am
not a weather expert, but my view of the different weather models for the
Marshall/Crestline area are as follows:
·
GFS: a lower-resolution model (uses a 12km grid), but provides
forecasts further out (5 days); I only look at GFS data as a means of comparing
one day over another (for example, if a day 3 days out might be better than a
day 2 days out), or to look several days in advance to see if a day might be
flyable (this is good for getting your hopes up as you plan your week, but be
prepared for disappointment). GFS ALWAYS overestimates top of lift (TOL).
·
ICON: a lower-resolution model (uses a 13km grid); I ignore
this one and don’t find it useful for the area.
·
NAM 3: my preferred model for the area; it is a
high-resolution model (uses a 3km grid), but only looks ahead 48 hours. I find
this to provide the most accurate guess of wind speed, wind direction, and top
of lift.
·
RAP: a lower-resolution model (13km grid). I don’t know much about this model and I don’t pay attention
to it, other than as a means of comparing against NAM 3 to see if they both
agree with one another.
·
HRRR: a high-resolution model (3km grid), but only
forecasts for the current day plus one day ahead. Seems as though many San
Diego pilots prefer this model over the NAM 3, and it often gets pretty close in forecasting TOL and wind speed/direction.
Useful for comparing against NAM 3.
Setup:
These two steps here you will only have to do once…
1.
Set up your user settings (you will want to set your
preferred height, wind speed, vertical speed, and distance units). Tutorial on where
to do that is here.
2.
Create a default profile - tutorial on
how to do that is here. My default profile, since I fly at Marshall
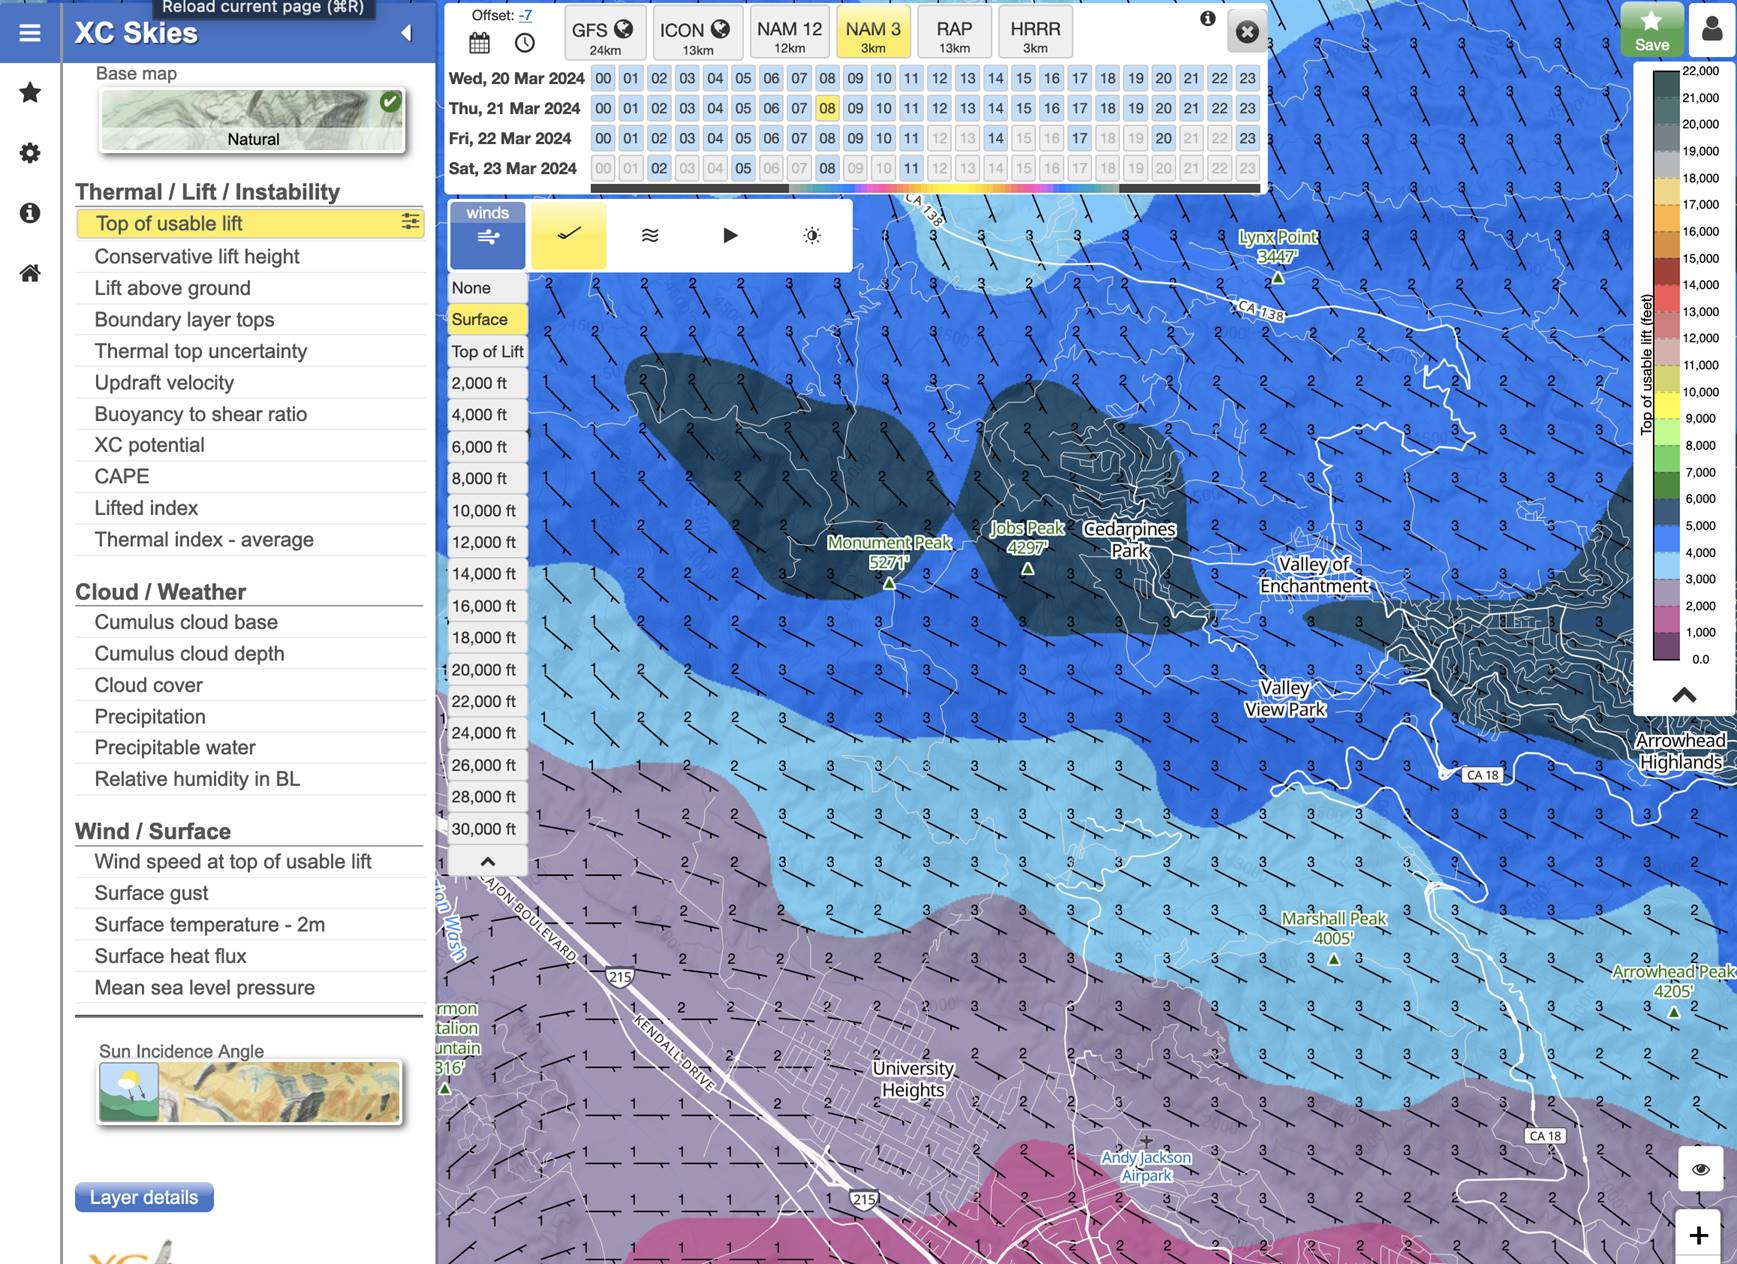
the most, is for that area. I like having “Top of usable lift” as the map layer
parameter selected, NAM 3 as the forecast model, and a zoom level that will
show Marshall peak on the map (with the road behind Crestline showing as well).
Here’s what mine looks like by default (the road that
runs through where it says “Valley View Park” is where Crestline launch is -
between “Valley View Park” and where that road turns upwards):
Forecasting
a good Marshall day:
·
One can look at either the colors on the map (with the
scale on the right side of the page to show elevation), or click on an area to
show you that information with all of the models
side-by-side (that’s what I do). So, for the screenshot above, if I click on
Marshall Peak, I get the following:
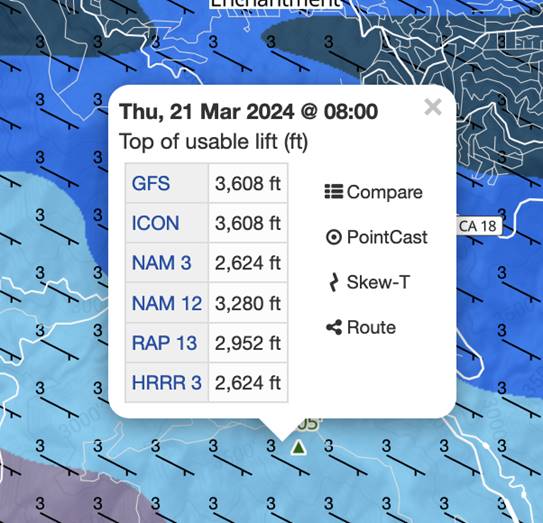
·
That shows me that at 8AM on March 21st, NAM 3 is showing the
TOL as 2624’ (under launch height). Not surprising since it’s
early in the morning.
·
Use the date and time selections at the top to select the
day and time that you want to be in the air. NAM 3 doesn’t
offer every single hour if you’re looking a day or 2 in advance, so if you want
to look at “tomorrow” and want to be flying in the afternoon, select the “14”
(2PM) box for the following day. That gives you the strong early-afternoon
conditions (likely as good as it’s going to be), and
for days after the spring time change, the 17 (5PM) will show you what it’s
going to be like for the last hours of flying before sunset (the calmer stuff).
Another example:
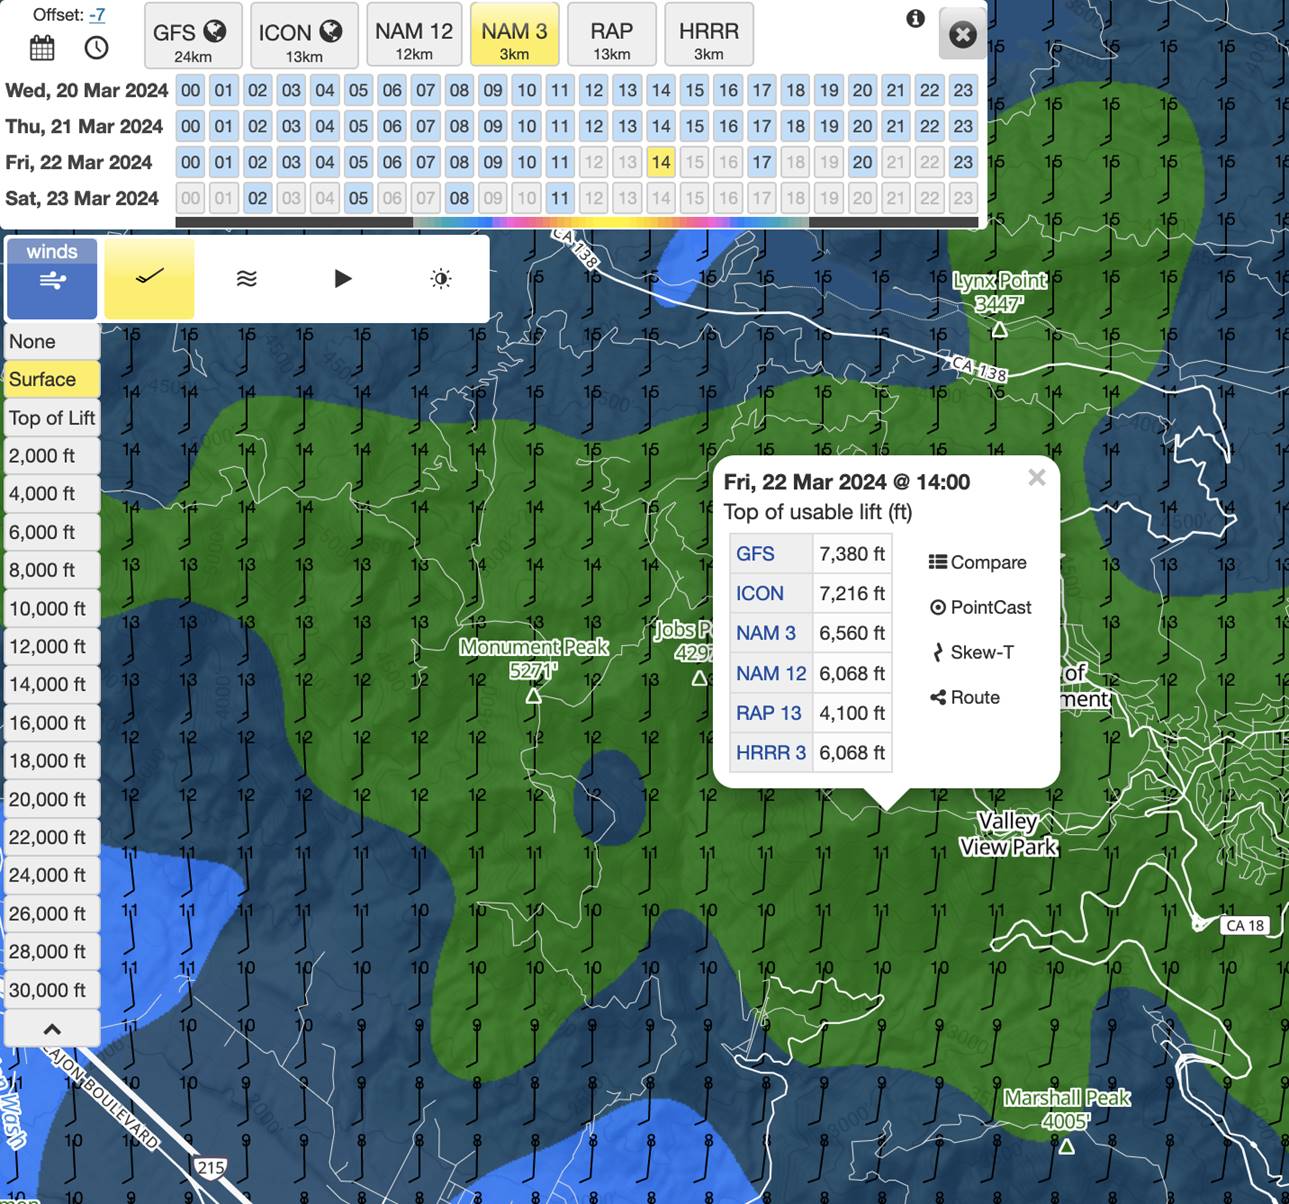
·
What I see is a good/typical afternoon. I clicked right
next to Crestline launch and it shows a TOL of just over 6500’, surface winds
from the SSW at 12mph at 2PM. Crestline launch is approximately 5200’, so my
next step is to look at the wind speed and direction at different elevations.
Click on the elevations on the left side and you will see the wind barbs on the
map change. Afternoon looks a little different now, looking at the 6000’ level
(just above Crestline launch):
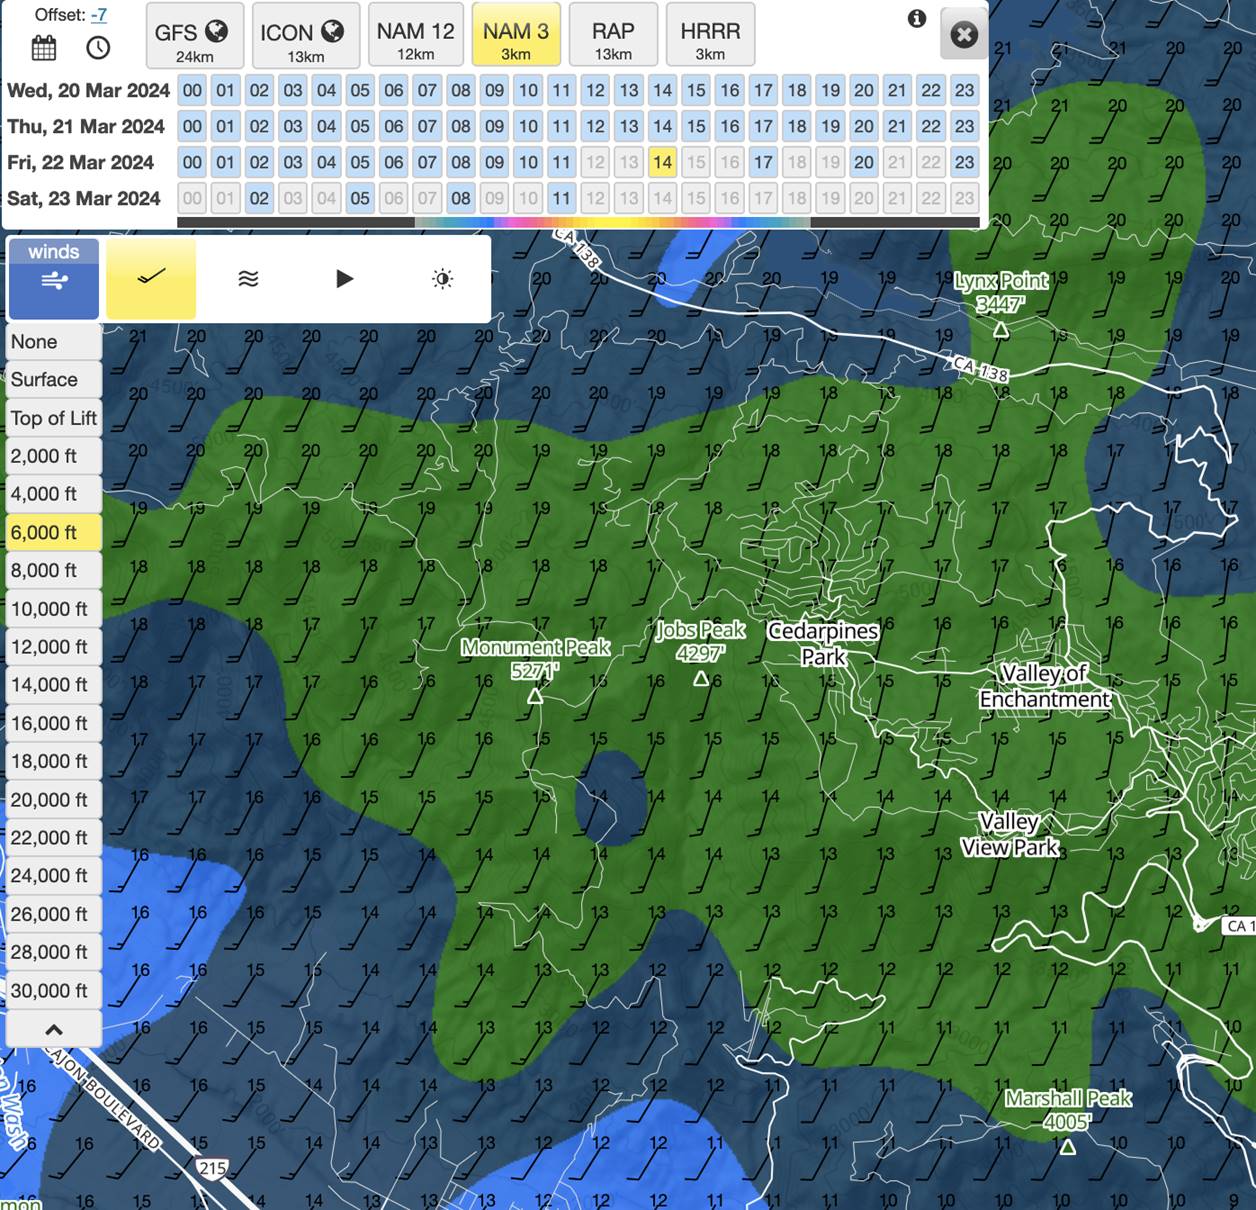
·
I’m now
seeing, at 6000’, 14mph winds, and one should expect a little bit stronger (NAM
3 seems to slightly underestimate on wind speed). Direction is still good. So,
looks like a decent day, but one would plan for it to be windy if you’re up around 5-6000’.
·
Days where the surface winds and winds up to 4000’ are
blowing in (S/SW/SSE), but winds at the 6000’ level are north can be flyable,
but depending on how high that change in direction is, the conditions on the
back ridge can be rough. Sometimes not an issue, but investigate with caution.
A really good day is when you start seeing lots of
green, light green, and yellow, and seeing that extending out to the east down
past the dam, and also seeing that green extending out into the flats (means
there will be nice altitudes everywhere over the mountain terrain and a good
day for adventuring east).
What
else I look at for comparison to give me more information on if the day might
be good:
1.
The windgram for Marshall (if for the time of day and
altitude, the wind speed, direction, and TOL agree with the NAM 3 data in XC Skies).
2.
The daily sounding.
You can also get the sounding information from XC
Skies, but this one limits the altitude to 18000’ (as high as we’re ever going to go) so it’s easier to read. It’s good to see the cloud base at least over 6k, and the
lapse rate up to the top of lift to be 4 or above. It also shows potential wind
speed at various altitudes in a different format (good for comparing against
the model data). This sounding is only available for the same day, so take a look at it before you get in the car as a last-check.
I won’t go into how to read thermal height on a skew-T
chart, but good to see that 5k or above (seems like at Marshall, we are almost
always able to do better than what the skew-T is showing for thermal height,
but I have no scientific data to prove that).
3.
The NWS forecast for wind speed and direction at Crestline.
Can be found on this
page and is the chart that looks like this:
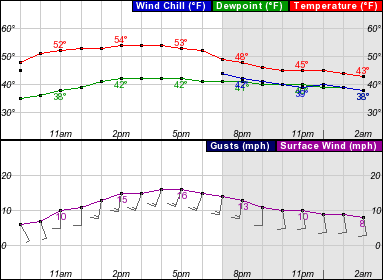
Again,
expect winds at Crestline to be slightly higher than that forecast.
4.
XC Skies (the “Cloud
Cover” and “Cumulus Cloud Base" options) plus the Windgram for seeing if there
will be low clouds or widespread fog (more of a factor if planning a morning
flight from Crestline - one wants to know if Crestline will be socked in or if
there will be a layer of clouds between you and the LZ).
5.
The NWS
Discussion. This is very useful for giving large-scale regional information
and gives great hints on whether the area might produce good flying days over
the next few days.
Just
for fun:
I don’t find this option particularly useful, but if you like
getting your hopes up or are an ambitious pilot, you can look at the “XC
Potential” option in XC Skies. If you see
red everywhere (extending in all directions from Marshall), it might be a good
day for adventuring. If you’re a more conservative
pilot, this won’t tell you much since you’ll likely be waiting for a
better/easier day and this view isn’t very good at showing that, but sometimes
fun just to look at it and dream.
Other:
One
can get very deep into details on XC Skies
and it provides way more information than I use, so if you’re very
knowledgeable about weather and are skilled at forecasting in general, you’ll
find it an excellent tool for figuring out if and where you’re going to fly, XC
route planning, and getting a deep sense of what the day will be like. Even so,
just using the basic data described above works well for me to figure out if a
long drive will be worth it and is pretty consistent
on showing me a good picture of what the day will be like. Your mileage may
vary.